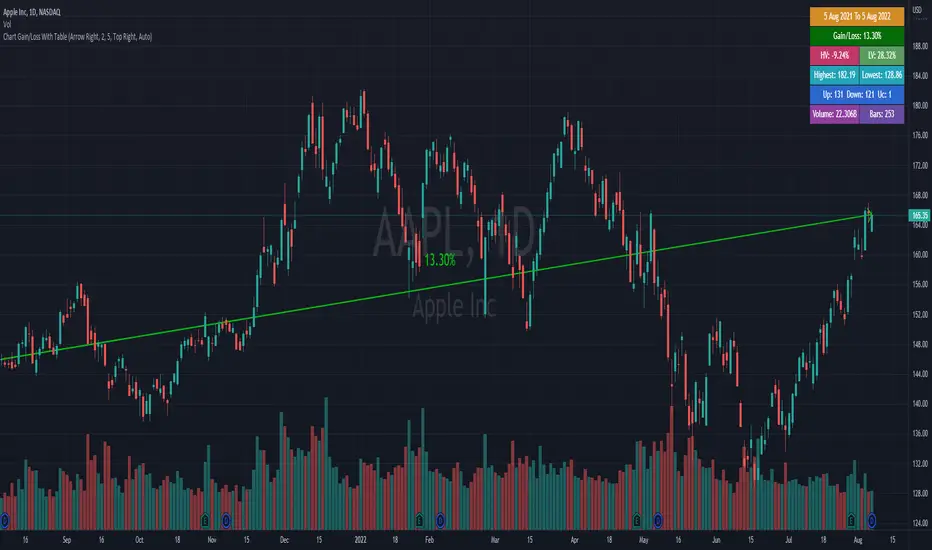
Chart Gain Or Loss With TableThis indicator auto calculate the first visible bar to the last visible bar
1. Gain or loss in percentage
2. Highest price
3. Lowest price
4. Total up bar
5. Total down bar
6. Total unchanged bar
7. Total bar
8. Total volume
*This indicator is not working on this page, you must add it in to your chart.
[i]price
Time Machine█ OVERVIEW
This script is designed to display future and current time resistance levels based on multiple techniques such as candle behaviors and count and some significant financial times according to Gann and more.
Each chart consists of an X-Axis ( time ) and a Y-Axis ( price ). Price can travel up and down giving you both support and resistance levels, on the other hand, time only travels forward which is why they are called time resistance levels.
Time resistance happens at multiple significant places. Have you noticed that when a triangle breaks north or south that the tip of the triangle acts as time resistance level where something happens ? Many patterns and techniques are designed
to detect and these levels through patters, candle behavior and more. This script aims to assist in detecting these levels ahead of time or at candle opens . This is a very important point. A signal of time resistance can be displayed at candle open
or ahead of time. both of these cases mean that the time resistance is confirmed. These resistance levels are rated on a scale from 0 to 3 and this scale could change and more filtering could be applied in the future to make this script
even more powerful. I would say this is a functional beta version ( v0.5 ) that could be improved upon and that's what I intend to do. scroll down to see if there are any other upgrades to this script. Each time frame has its own time resistance levels. Future levels could appear at any point;
for example, if there are no future time resistance levels within the next 6 days -lets say,- this does not mean that one doesn't appear tomorrow. A regular check would give you an edge in this script. Of course this is something that can be improved in the near future. This script does not reprint ( confirmed data does not change ) but more future data can be added no previous data.
Enjoy!
█ Future Plans and upgrades to this script may include :
1. Adding more astro influencers into the script.
2. Fine tuning the script a bit more to filter unwanted noise.
3. Adding toggle switches for users to select from. ( toggle between multiple techniques )
and more! feel free to let me know what you'd like to see!
█ How to use :
1. Put the script on your chart
give the script a few seconds and you should be set.
This script is coded as an addon to the Gann ToolBox package/scripts.

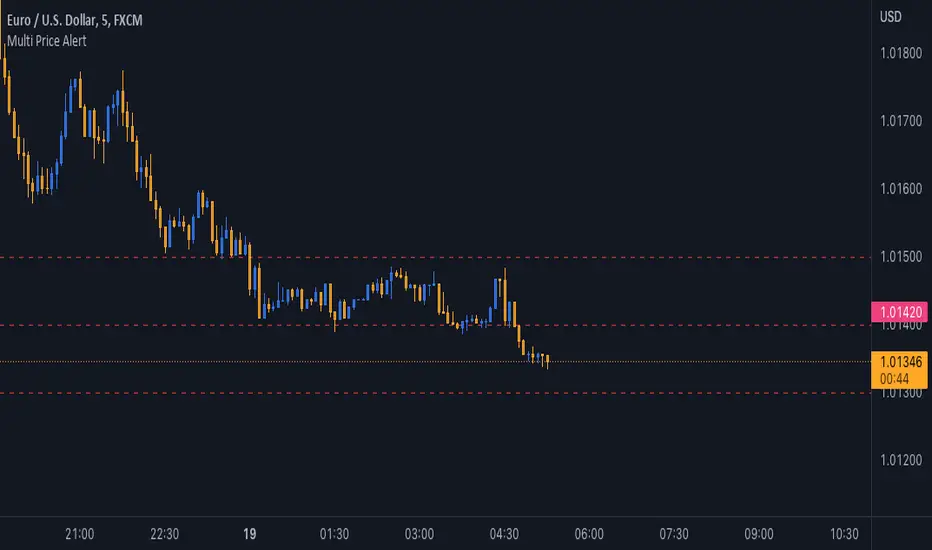
Multi Price AlertSometimes you need set some alert at specific price levels on a chart.
Now you able to set ten different price levels to get alert at this prices.
With this Indicator also Basic Accounts can set more than one alert at price levels.
How to Use :
1- Enable Indicator on your Chart
2- Input your prices on Indicator Settings
3- Active Indicator Alert on 1m Chart (Select Multi Price Alert on Conditions Menu & Once Per Bar on Options)
5- Enjoy !
Notice : If change at prices, you should remove and reset Alert again.
Good trading to all ...
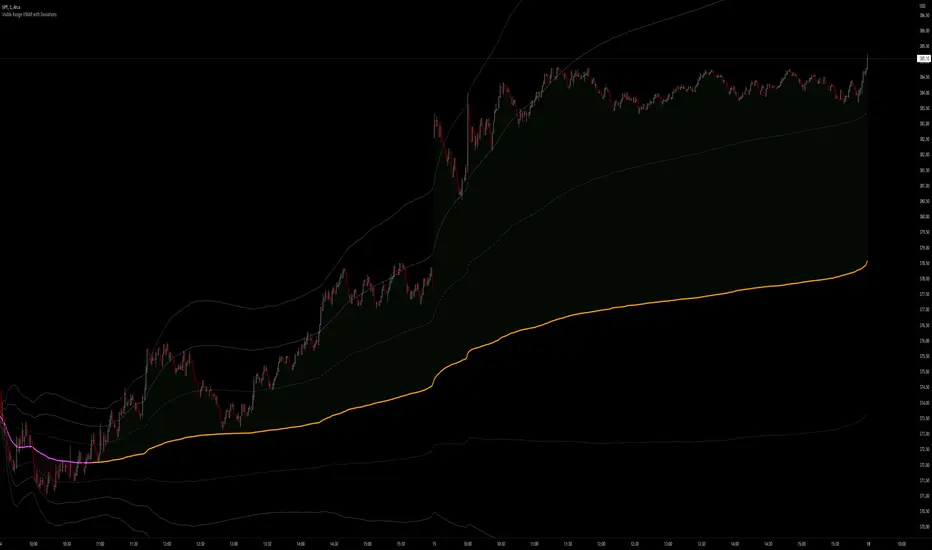
Visible Range VWAP with DeviationsImplementing Pine's new Visible range function I have built with the help of @RumpyPumpyDumpy a Visible range Vwap with Standard deviations in the same style and color way originally created by Zach Hurwitz, This is created in the styling and under the teaching of his education over the last few years. Zach uses intraday, and long term strategy based around 4 trade types that are taken in and around Vwap and its deviation bands. Whether that is intraday vwap , Longer term time based vwaps, Event based vwaps such as earnings , Gaps, Highest Volume based, and now "Visible range" based vwaps. The new visible range function is a huge help and time saver when wanting to quickly see a longer dated vwap or a vwap from a specific spot on your chart. All you have to do is scroll to that position on the chart and the Vwap and bands automatically launches from the furthest most left candle on your chart using the source input user chooses, HLC3, High, Low, etc.
This is a fully functional Volume weighted average price and launches on the furthest most left bar on your chart. It comes set to calculate the average price based off the launch candles HLC3 value, or User can choose to change the source input to High or Low for custom anchored visible range high/low vwap showing overhead resistance or support from underneath.
The deviations can be used as support and resistance intraday or longer time frames. Myself and others in our community have 4 trade type set ups that we take in and around Vwaps deviations. It offers us consistent, and manageable risk points at measured distances away from average price, and specific targets to aim for intraday and in longer time framed swing trades.
Vwap and its deviations are a institutional benchmark and a tool that higher time frame and institutional traders around the world use as a guide. With the use of visible range and multiple launch points on the candle we can quickly get an idea of where participants may be buying and selling, or trapped or supportive of price.
Standard deviation bands and the color-coding reflects the market’s current position and slope. This can now be applied to the visible range of your entire chart, and you can quickly understand whether the market is trending positive, negative, or flat and counter trend.
I have included our traditional color way of Zach's original vwap indicators that were originally released on TOS and now also available on TradingView. This shows a yellow positive sloped vwap , or magenta negative sloped vwap . User also has choice of slope signal which shows positive, negative, neutral, or single color choice.
There is also positive and negative cloud coloring behind price to show when price is above or below visible range vwap . This helps immediately understand whether price is moving in your favor or against. In addition there is the choice of brightly highlighting what we refer to as the "Fast lane", which is a trending market either positive or negative in plus one or negative one deviation. You can use them independently, or choose not to color them at all. There is also Positive and negative coloring options for the Deviation plots themselves, which in positive trend will color the upper deviations green or in negative trend color them red.
User also has the choice to add "Tolerance bands", which are sub deviation levels usually used in 0.25-0.50 increments. These show a zone above and below each deviation of which price may test above or below. We do not think as vwap as a hard "Line in the sand" rather a zone where we look for participation from those that are currently in that average price, this means price sometimes may move slightly under the vwap or deviation level as price seeks liquidity and the Tolerance bands can add some insight in an event like this.
As always-
*** ALL USERS ASSUME ALL RESPONSIBILTIY WHILE USING THIS TOOL. THIS IS NOT, NOR SHOULD NOT BE MISCONSTRUED AS FINANCIAL ADVICE. USER ASSUMES ALL RISKS ASSOCIATED WITH THE USE OF THIS TOOL WHILE TRADING,AND FOR ANY AND ALL LOSS THAT MAY OCCUR WHILE USING SAID TOOL. TRADING IS RISKY AND USER COULD STAND TO LOSE ALL CAPITAL INVESTED.
Hope you enjoy.
Thanks
-JMF
VWAP With EMA Overlay (Adjustable Anchor)For those who want the classic Volume Weighted Average Price and Ema on the same overlay.
This script utilizes the same protocols as the VWAP and EMA you currently use. Just frees up an indicator space.
KEEP UP TO DATE
Are you a college student or graduate?
Join College Town Trade discord for helpful community specializing in trading stocks, options, and crypto.
Our staff consists of a group of college students with 10+ years of combined experience. Collectively we have profited and made well above an average yearly salary while being in college. The community aspect is everything and the team always listens and appreciates feedback. We all earn and learn together. There are free trials in place in order for you to see what it’s all about. These are in place so we can gain your trust and show transparency!
I look forward to seeing you in the community
advBtBjDhk

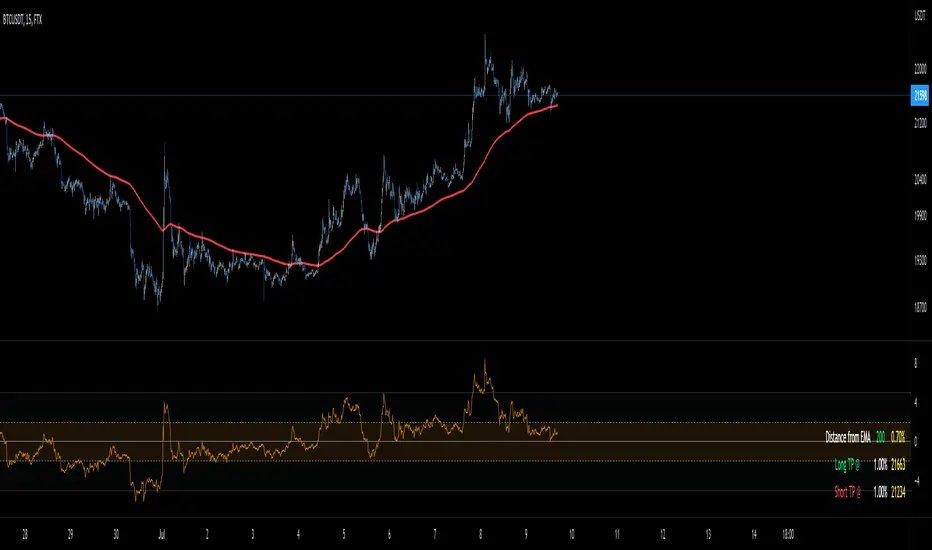
Distance From EMA (%) with TP TableThe indicator will help you to identify where an asset might change direction or where to take profit.
For scalping or day trading is very useful to know where to take profits.
When the price is too far from an EMA a reversal is very likely to occur.
You can set up your own EMA and the percentage where you want to take profits
HorseShoe - At NalıHorseShoe - At Nalı
English
HORSEHOE FORMATION
It is actually a kind of bobbin. As with the bobbin, the needles of the candles are not taken into account much.The difference is that there are only four candlesticks in this formation. There is no limit to this in the bobbin.In addition, it is important which of the bars forming the bobbin is longer or shorter than which.is not. This is very important in a horseshoe. There is a rule for the length and shortness of the bars.Candlesticks in a horseshoe showing the bearish sequentially rising, falling, rising and repeatingin the form of falling bars. Also the lengths of the first and fourth bars, i.e. price opening andThe differences between the closing must be longer than the second and third bar. So those on the sideshould be clearly larger than the middle ones. For the rise, the bars are falling-rising-falling in order.The rising candle should be in the form of a bar. Likewise the first and last barsshould be longer than the middle ones.Of the first and fourth bars, it is better if the fourth bar is longer than the first.was the signal. But the fact that they are equal or the first one is long does not mean this formation. Attentionthe first and last bars that need to be beat are clearly longer than the middle onesrequired. A millimeter long means a very weak signal.
It is valid for every price and parity. But this is not a magic wand, so every horseshoemay not be the correct signal. Trend, Supdem, Correlation and other similar components are alsois involved, a highly efficient signal is formed. Well reviewed onexperience must be gained. More like an indicator to show the direction of the price rather than a signalshould be used.
Turkish
AT NALI FORMASYONU
Aslında bir tür bobindir. Bobinde olduğu gibi mumların iğneleri çok dikkate alınmaz. Farkı, bu oluşumda sadece dört mum çubuk vardır. Bobinde bunun sınırı yoktur. Ayrıca bobini oluşturan barların hangisinin hangisinden uzun ya da kısa olduğu önemli değildir. At nalında bu çok önemlidir. Barların uzunluğu kısalığı ve sırasında bir kural vardır. Düşüşü gösteren at nalında mum çubuklar sırayla yükselen düşen yükselen ve tekrar düşen barlar şeklindedir. Ayrıca birinci ve dördüncü barların uzunlukları, yani fiyat açılış ve kapanışı arasındaki farkları, ikinci ve üçüncü bardan daha uzun olmalıdır. Yani kenardakiler ortadakilerden net bir şekilde büyük olmalı. Yükseliş için ise barlar sırayla düşen-yükselen düşen-yükselen mum çubuk şeklinde olmalıdır. Aynı şekilde ilk ve son barlar ortadakilerden uzun olmalıdır. Birinci ve dördüncü barlardan dördüncü barın birinciden uzun olması daha güze bir sinyaldi. Fakat eşit olmaları ya da birincinin uzun olması da bu oluşumu bozmaz. Dikkat edilmesi gereken ilk ve son barların açık bir şekilde ortadakilerden uzun olması gerekmektedir. Milim farkla uzun olması çok zayıf bir sinyal olması anlamına gelir.
kaynak:
Price Action TR

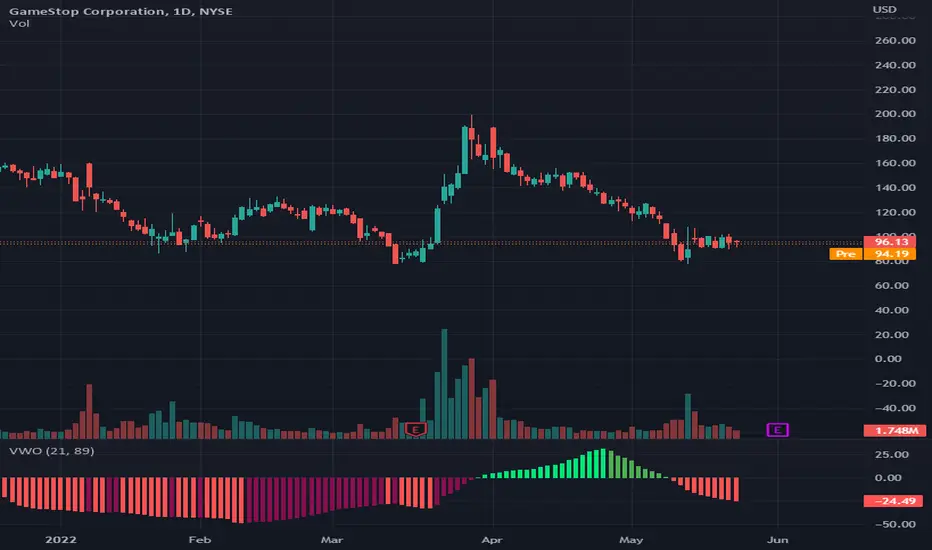
Relative Volume Force IndexThis indicator can anticipate the market movements. Its posible because it calculates how much force (volume) it's necessary to move the price up or down. If it's necessary a lot of volume to move the price a little it's a reversion signal, but if a little volume could change the price whit elevate volatility, it's signal of reversion too. The indicator plots red if the market is down, and green if it's up, the size and the color of the bars cand demonstrate the movement relative force. Does it by the configurable averages. Not works well whit poor liquidity.

dize Automatic Support and ResistanceHi Trader,
the "Automatic Support and Resistance" indicator is one part of our holistic approach to identifying trading setups. It is one of many indcators of our dize indicator package and should always be used in conjunction with the other dize indicators.
💡 What is the Automatic Support and Resistance indicator?
The "Support and Resistance" indicator calculates support and resistance zones based on our proprietary algorithm. It is a "Price Action" indicator where the market behavior is decisive. You can choose between 5 modes for the calculation of the respective zones - swing, volume point-of-control, price point-of-control, closing or average prices. Each mode builds a unique underlying dataset to calculate the support and resistance levels.
Note: The support and resistance level will be recalculated on each candle to keep them accurate. It can therefore repaint those levels or print new levels as time progresses. That is an intended feature.
💡 How to use it?
Looking at the settings, the "Depth" and "Resolution" parameter come into play, when you use the "Volume POC" or the "Price POC" mode. Please be aware, that the resolution should always be smaller than the selected timeframe displayed on your chart. The Depth parameter determines how precise the calculation for the volume POC and price POC levels will be. A higher number means smaller cluster and therefore more precise values.
The "Number of data points"-parameter can be used to specify how far the indicator should look into the history for calculating the zones. While the "Mode" decides how the underlaying dataset will be interpreted. Our calculation method is unique and therefore so powerful. Due to a continuous calculation, the indicator always shows the zones accurately, so that the zones have a great significance.
In addition to the settings for the calculation, there are also settings that affect the visualization. The display can be changed using the "Show Level" checkbox, switching between the "Level"- and the "Box"-mode. Based on the positioning of the closing price to the respective support or resistance zone, the indicator colors the zone using the colors specified in the settings.
Let's have a look how we can use the Suport and Resistance indicator to our advantage:
As you can see the price hit the displayed support and resistance level multiple times. The above example is one of many use cases for the power index indicator.
🔓 To gain access to this indicator, please read the signature field.

Zero Lag Detrended Price Oscillator (ZL DPO)This indicator attempts to create a zero lag Detrended price oscillator using 2 different scripts. I actually really like the results so far. I hope you all find it useful too.
Green>Red = long
Red>Green = short
The lines on the example chart are some of the signals that the indicator gave on default settings.
The greens are wins, reds are outright losses, and blues are "scratch" trades(signal for other side before hitting stop loss).
All of the signals tested were using NNFX money management to see if they are wins or losses(1.5x atr for SL and 1 Atr for TP).

Custom Price LineThis indicator lets you freely customize your price line. Choose between static or dynamic colors for falling/rising prices. In addition you can adjust the following:
Line style
Thickness
Length
Direction
It is also possible to mix different designs by using a single indicator.

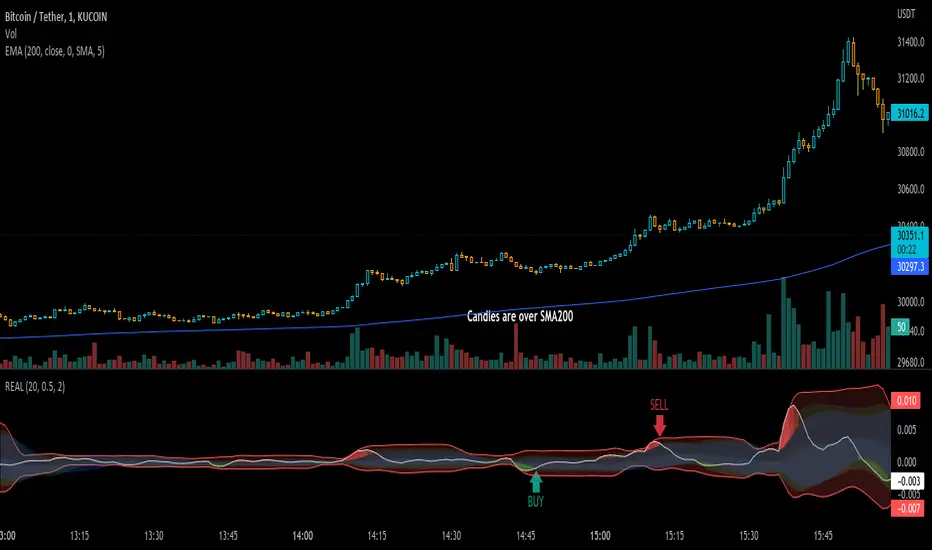
Real IndicatorReal indicator is an indicator to convert ohlcv charts to one oscilator!
there is an effective thing in all charts: "Volume", and I used this thing to mix it by price
Buy: on crossing above to Bollinger-lower-band (on Up-trends)
Sell: on crossing under Bollinger-upper-band (on Down-Trends)
use an SMA-200 to determine trends ;)
VWAP OscilatorVWAP Oscillator - Awesome Oscillator but using different period Volume Weighted Average Price values instead of moving averages. Used to get an idea of the momentum of price movements and when momentum might be reversing.
MidWeekPlotMid week high and low Plotting , usefull for finding a mid range or Expiry range detail of High and low

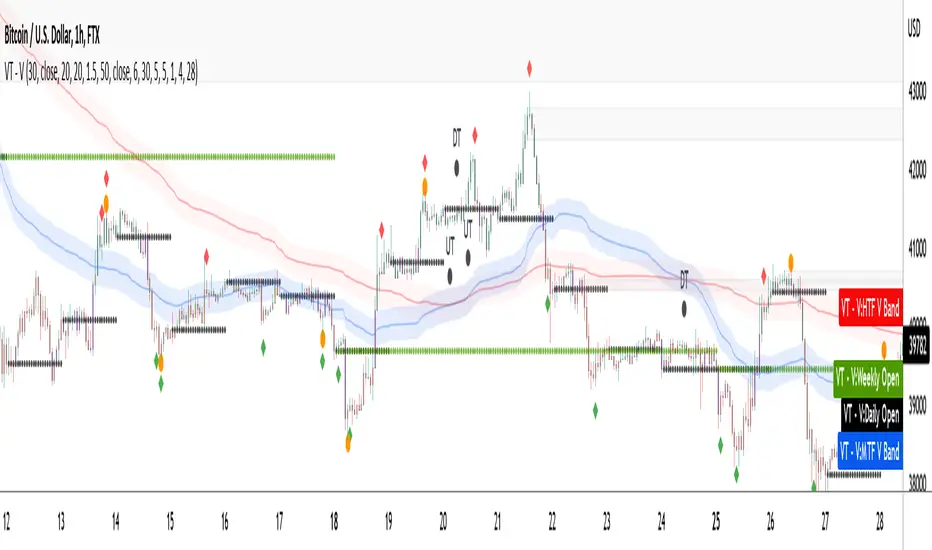
VTrend - Volume ScriptThe Volume script is designed to help you trade the market more efficiently, giving you a lot of information to intrepret, based on volume calculations.
The fundamental part of the script, is the volume weighted bands in blue and red, which help determine the trend and dynamic support and resistance. The blue band is a shorter length than the red band.
When the blue band dips below the red band, this tells us there is a downtrend. And when the blue band is trending above the red band, this is bullish uptrend price action. You will be able to note price whatever the timeframe really respects these bands, and you can use that to your advantage flicking through the high timeframes on where price will go next, combined with your own support and resistance levels.
The other most important aspects are the bar colors and the colored bollinger band line. Whenever price action is above the blue band the bars are green, when closing within the blue band, they are orange to show possible resistance or support. Below the blue band the bars are red for downtrend price action.
When the bars are bouncing off the daily open, a key level for you to play off everyday and makes it easier to gauge what price is doing, the bars are colored purple to highlight this.
The bollinger band line serves to act as a trendline, to help identify where price is going combined with the information above in the short term, and allows you to pick entry points more finely. There are also two bollinger band clouds in the background, which are areas to look at reversal or support for. You can turn these off if you wish, as not to clog up the chart.
Next feature up, are the reversal signals, which also double as areas to take profit. The default are the diamond reversal plots.
Enabled by default also are the custom leledc exhaustion plots, the major signals are enabled by default, whilst the minor signals are not turned on and are very noisy by comparison, especially at low timeframes.
You'll notice in the screenshot below, there is a black MA, that is an adjustable Hull Moving Average included for determining shorter term trend movements combined with the bollinger band colored line, depending on your trading style.
The image below shows when both major and minor leledc signals are turned on.
Also we have circular colored plots showing different reversal calculations, you can use them as a guide and take profit areas. These are based on candle type, and i consider them noisy especially at low time frames.
The indicator is designed to give you key information, but be quite customisable as well to suit your exact trading style.
Recommended timeframes i use this on; Weekly (for key liquidity areas), Trading on the Daily, 6h, 4h, 2h, 1h, and 25 minutes.
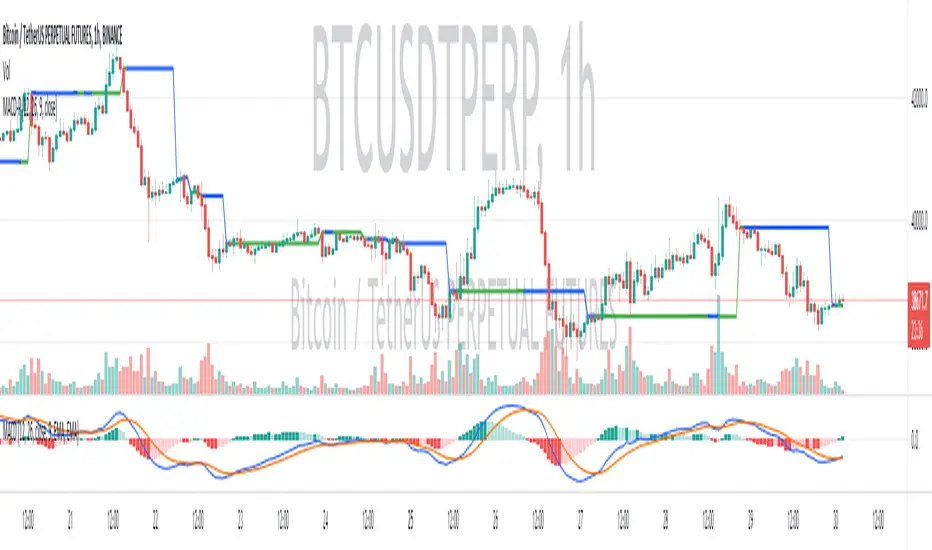
(MACD-Price) Displaying MACD Indicators on Price Chartshello?
Although it is a simple indicator, I decided to disclose it because I thought it was a pretty useful (?) indicator.
** Others may have previously published indicators similar to this indicator.
** Please understand this.
** All charts or indicators disclosed are not guaranteed to result in profit or loss.
** Therefore, please use it as a reference for your own trading strategy.
(design purpose)
The MACD indicator is a secondary indicator and is located below the price chart.
Accordingly, it is not easy to check along with the price flow.
Therefore, the index has been reorganized to display important factors in interpreting the MACD index according to the price change.
(Metric Description)
- The center line of the EMA line corresponding to the MACD value and the signal value displayed in the MACD indicator is designed to receive the Close value or Open value among prices according to changes in the rise and fall.
- The color of the line displayed in the manner described above is designed to change color when the Histogram passes the zero point, so that you can check whether the current state is in an uptrend or a downtrend.
Uptrend: green
Downtrend: blue
(How to Interpret and Apply)
- Buy when the 'Buy / Sell line' of the MACD-P indicator is level and the color is green, and when it crosses the 'Buy / Sell line' upwards.
- Sell when the 'Buy / Sell line' of the MACD-P indicator is level and the color is blue, and when it crosses below the 'Buy / Sell line'.
% Price change (by OP)To visually evaluate the percentage change in price over any time period
This handsome indicator shows exact % price change at each candle by displaying a circle at the level of the change. To read numerical value, point at the circle of the relevant bar corresponding to the candle you are interested in, and look at the scale.

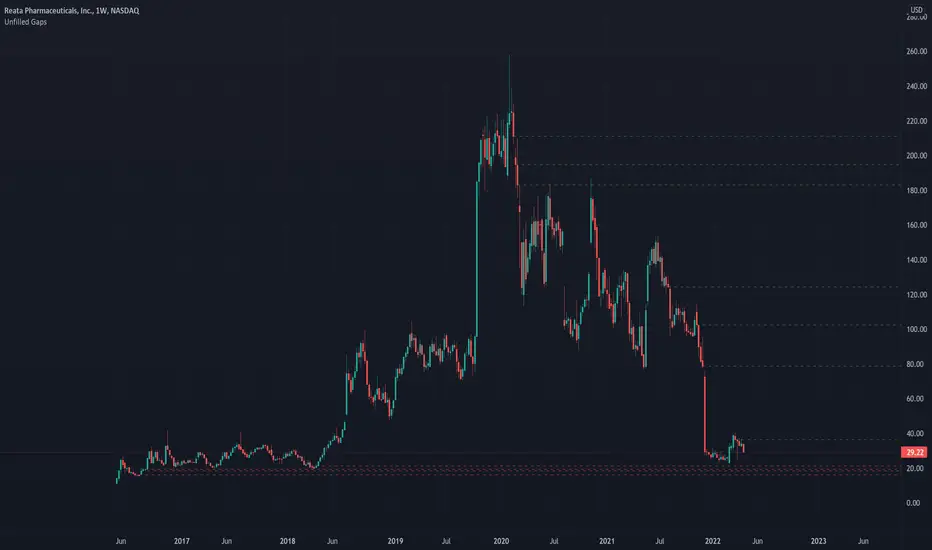
Unfilled GapsThis indicator displays gaps which have not been filled.
Notes:
- It shows only the unfilled gaps.
- You can edit the style and color of the gap lines.
- It will not work on charts with huge number of candles or gaps.
- It's based on someone else script which is mentioned in the code comments.
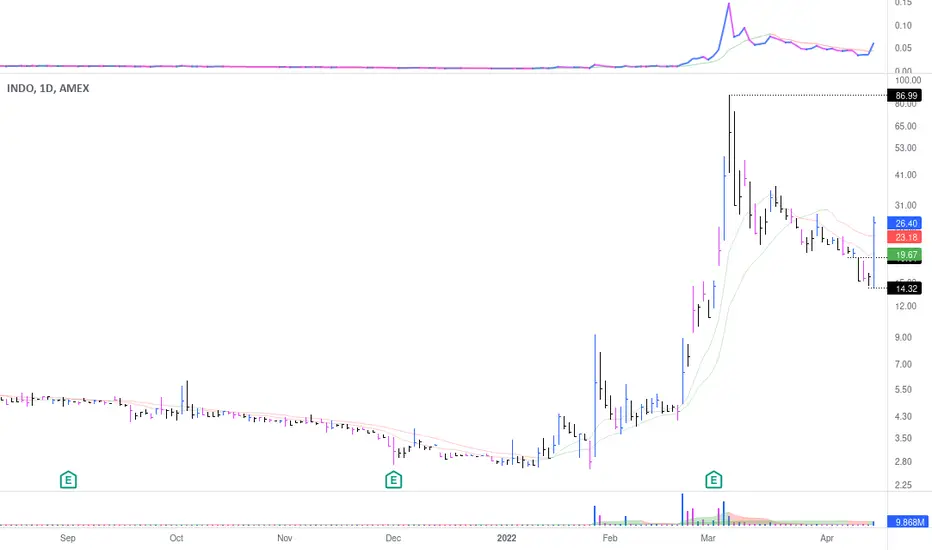
Capeya Bar ColorColor bars based on price and volume.
Volume can be set dollar denominated.
Change can be set close to close.
Volume can meet a threshold.
Color is bullish if the change is positive & bar's volume is greater than previous bar's volume.
Color is bearish if the change is negative & bar's volume is greater than previous bar's volume.
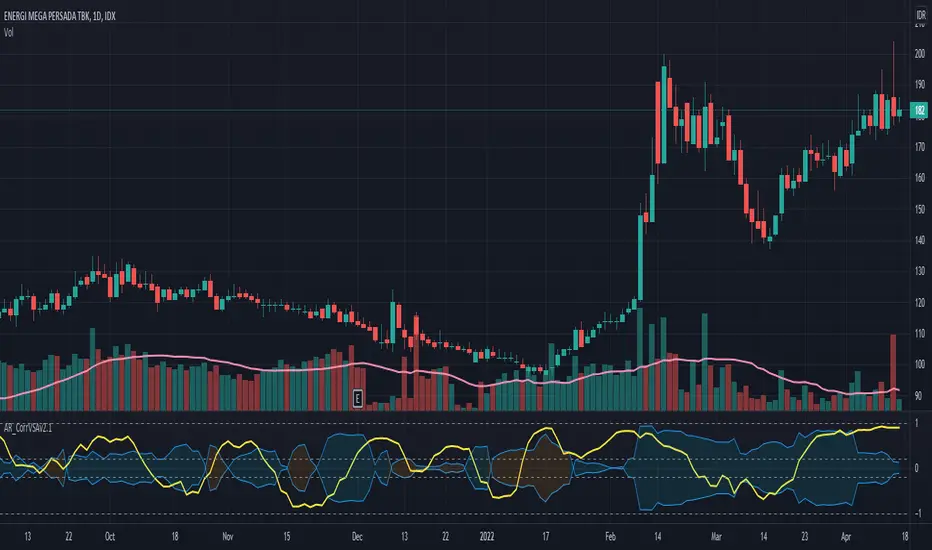
Correlation of Price Spread and VolumeCorrelation between candle's price spread (length of candle of each bar) and volume.
Generally, increases in volume precede significant price movements. However, If the price is rising in an uptrend but the volume is reducing, it may show that there’s little interest in the instrument, and the price may reverse.
The closer the correlation is to 1.0, indicates the instruments will move up and down together as it is expected with volume and price spread. So the correlation Indicator aims to display when the price spread and volume is in correlation and not. Blue color represent positive correlation while orange negative correlation. The strength of the correlation is determined by the width of the bands.
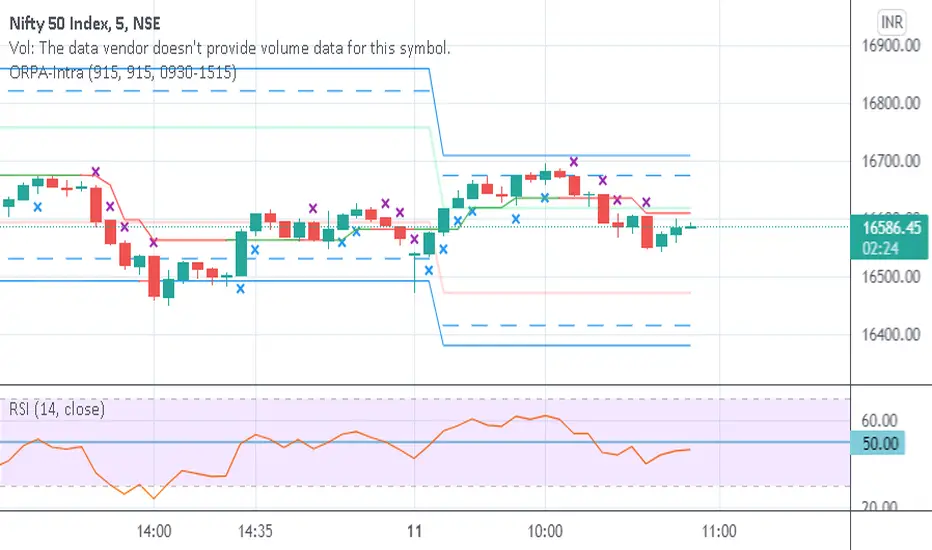
Opening Range-Price Action IntradayThis combines Opening Range of 15 min and Price Action in one script. Crosses are marked on candles for upside and downside. Break of High/Low of cross marked candles gives direction of market.
Heatmap WatchlistThis is a Heatmap for custom watchlist tickers. Similar to S&P500 Heatmap .
Add up to 20 tickers.
Check higher timeframe from a lower timeframe.
Check previous candle for any timeframe.
Switch on/off "Price%" and/or "Volume%" heatmap.

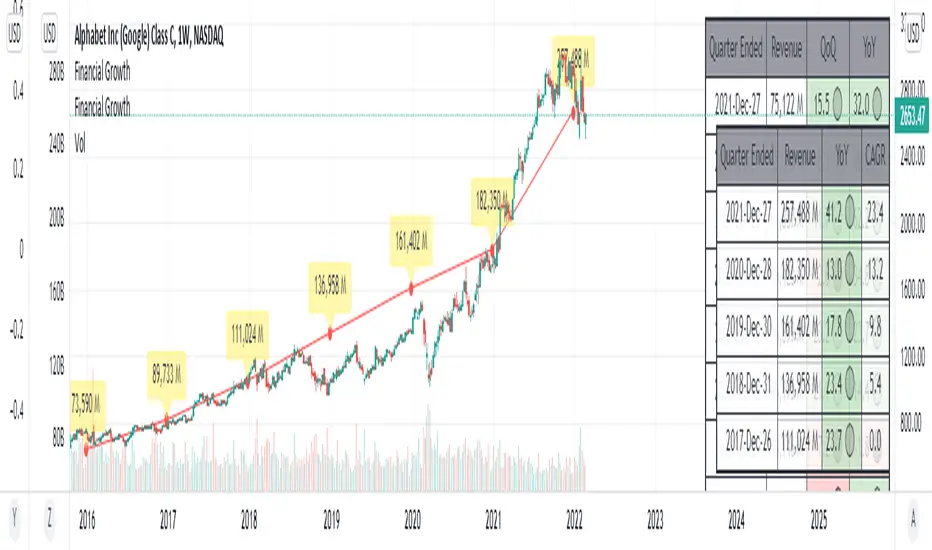
Financial GrowthThis indicator will acquire the financial data provided by Tradview.
the data is compare between Quarter, Annual and TTM in term of percent of growth.
YoY, QoQ and CAGR is also available by this script (The minimum is 4).
in addition, ploting of data, label and table also available (you can check the mark to toggle on / off).
Data : Revenue, Net Income, EBITDA, EPS, DVPS, Free Cash Flow and Forward PE .
How to use it.
just select the financial data, period and size of data to compare.
you can check the box to toggle the plotting line, label and table.
Enjoy.